System event monitoring facility allows to debug different problems using Logs. Log file is a text file created in the server/router/host capturing different kind of activity on the device. This file is the primary data analysis source. RouterOS is capable of logging various system events and status information. Logs can be saved in routers memory (RAM), disk, file, sent by email or even sent to remote syslog server. All messages stored in routers local memory can be printed from Read more about logging on RouterOS here>>
Torch is realtime traffic monitoring tool that can be used to monitor the traffic flow through an interface. You can monitor traffic classified by protocol name, source address, destination address, port. Torch shows the protocols you have chosen and tx/rx data rate for each of them.
The following example monitor the traffic generated by the telnet protocol, which passes through the interface ether1.
To see what IP protocols are sent via ether1:
In order to see what protocols are linked to a host connected to interface 10.0.0.144/32 ether1:
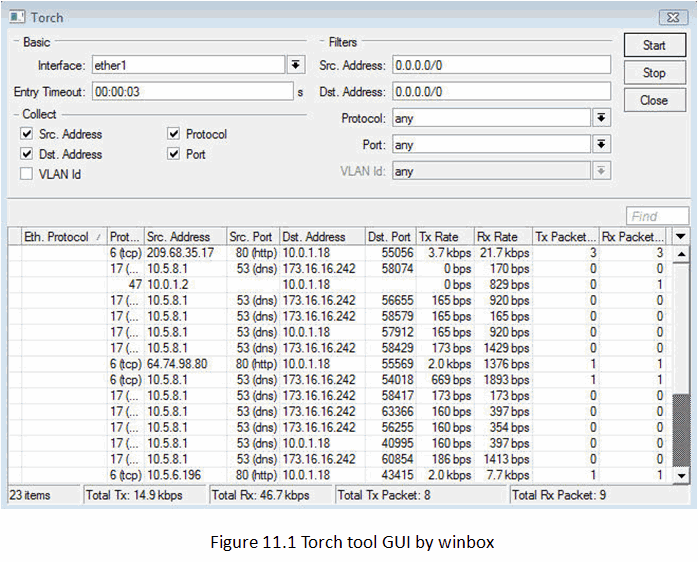
Starting from v5RC6 torch is capable of showing IPv6 traffic. Two new parameters are introduced src-address6 and dst-address6. Example: More attractive Torch interface is available from Winbox (Tool>Torch). Packet sniffer is a tool that can capture and analyze packets sent and received by specific interface. packet sniffer useslibpcap format. Packet Sniffer Configuration In the following example streaming-server will be added, streaming will be enabled, file-name will be set to test and packet sniffer will be started and stopped after some time: Here you can specify different packet sniffer parameters, like maximum amount of used memory, file size limit in KBs. Running Packet Sniffer Tool There are three commands that are used to control runtime operation of the packet sniffer: /tool sniffer start, /tool sniffer stop, /tool sniffer save. The start command is used to start/reset sniffing, stop - stops sniffing. To save currently sniffed packets in a specific filesave command is used.
There are also available different submenus for viewing sniffed packets.
For example:
Detailed commands description can be found in the manual >>Log Files
/log menu. Each entry contains time and date when event occurred, topics that this message belongs to and message itself.[admin@MikroTik] /log> print
15:22:52 system,info device changed by admin
16:16:29 system,info,account user admin logged out from 10.13.13.14 via winbox
16:16:29 system,info,account user admin logged out from 10.13.13.14 via telnet
16:17:16 system,info filter rule added by admin
16:17:34 system,info mangle rule added by admin
16:17:52 system,info simple queue removed by admin
16:18:15 system,info OSPFv2 network added by admin
Torch (/tool torch)
Example: [admin@MikroTik] tool> torch ether1 port=telnet
SRC-PORT DST-PORT TX RX
1439 23 (telnet) 1.7kbps 368bps
[admin@MikroTik] tool>
[admin@MikroTik] tool> torch ether1 protocol=any-ip
PRO.. TX RX
tcp 1.06kbps 608bps
udp 896bps 3.7kbps
icmp 480bps 480bps
ospf 0bps 192bps
[admin@MikroTik] tool>
[admin@MikroTik] tool> torch ether1 src-address=10.0.0.144/32 protocol=any
PRO.. SRC-ADDRESS TX RX
tcp 10.0.0.144 1.01kbps 608bps
icmp 10.0.0.144 480bps 480bps
[admin@MikroTik] tool>
IPv6
admin@RB1100test] > /tool torch interface=bypass-bridge src-address6=::/0 ip-protocol=any sr
c-address=0.0.0.0/0
MAC-PROTOCOL IP-PROT... SRC-ADDRESS TX RX
ipv6 tcp 2001:111:2222:2::1 60.1kbps 1005.4kbps
ip tcp 10.5.101.38 18.0kbps 3.5kbps
ip vrrp 10.5.101.34 0bps 288bps
ip udp 10.5.101.1 0bps 304bps
ip tcp 10.0.0.176 0bps 416bps
ip ospf 224.0.0.5 544bps 0bps 78.7kbps 1010.0kbps
Winbox
Packet Sniffer (/tool sniffer)
[admin@MikroTik] tool sniffer> set streaming-server=192.168.0.240 \
\... streaming-enabled=yes file-name=test
[admin@MikroTik] tool sniffer> print
interface: all
only-headers: no
memory-limit: 10
file-name: "test"
file-limit: 10
streaming-enabled: yes
streaming-server: 192.168.0.240
filter-stream: yes
filter-protocol: ip-only
filter-address1: 0.0.0.0/0:0-65535
filter-address2: 0.0.0.0/0:0-65535
running: no
[admin@MikroTik] tool sniffer> start
[admin@MikroTik] tool sniffer> stop
In the following example the packet sniffer will be started and after some time - stopped:
[admin@MikroTik] tool sniffer> start
[admin@MikroTik] tool sniffer> stop
Below the sniffed packets will be saved in the file named test: [admin@MikroTik] tool sniffer> save file-name=test
View sniffed packets [admin@MikroTik] tool sniffer packet> print
# TIME INTERFACE SRC-ADDRESS
0 1.697 ether1 0.0.0.0:68 (bootpc)
1 1.82 ether1 10.0.1.17
2 2.007 ether1 10.0.1.18
3 2.616 ether1 0.0.0.0:68 (bootpc)
4 2.616 ether1 10.0.1.18:45630
5 5.99 ether1 10.0.1.18
6 6.057 ether1 159.148.42.138
7 7.067 ether1 10.0.1.5:1701 (l2tp)
8 8.087 ether1 10.0.1.18:1701 (l2tp)
9 9.977 ether1 10.0.1.18:1701 (l2tp)
-- more
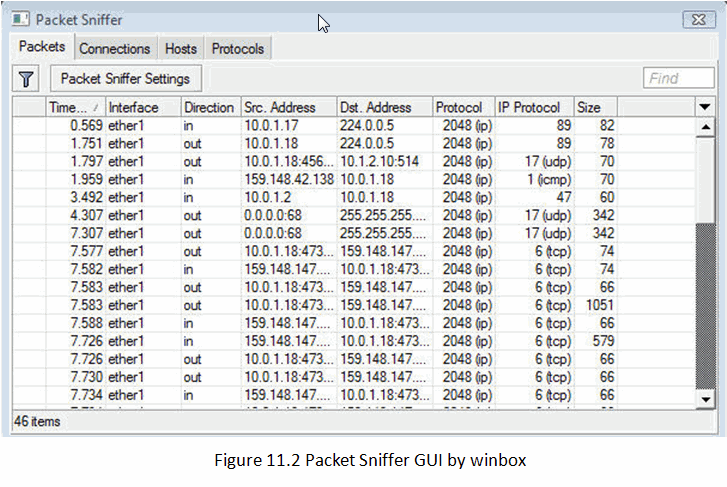
Figure below shows sniffer GUI in Winbox, which is more user-friendly.
Manual:Troubleshooting tools part 2
www.basic-mikrotik.blogspot.com on 05.39. Documentation -


Join The Community